


IBD Leaderboard Review – The Results Are In

IBD Leaderboard Review
In this Leaderboard review I examine IBD’s stock picking subscription service. A subscription service where IBD does the time consuming research for you, then presents you with a list of stocks near their buy points.
While subscribing to proven services such as Leaderboard is the fastest way for anyone to make gains in the market when they first start, in this IBD Leaderboard review I’ll go over the four things you need to look for when evaluating any trading service such as Leaderboard.
When I first started investing, I subscribed to the IBD Newspaper and read many of William O’Neil’s books. Great education. However, this is not about those products but about their Leaderboard subscription service.
4 Things To Look For
There are 4 things I look for when reviewing a service like IBD Leaderboard
- What are my expected returns?
- How much will it cost me to get those returns?
- Can I do the required trades on my schedule?
- Do they have a money-back guarantee period to allow you to verify returns and to see if it is for me?
So let’s get started with this Leaderboard review by starting with my most important criteria, “expected returns”.
What Are My Expected Returns?
On a recent check of their website (June 23, 2026) I found Leaderboard no longer posts the results of their model portfolio on their sales page. I did a bit of digging and did find they do a video of what they call the “Leaderboard Scorecard”. In those videos they do post graphs showing what their model portfolio returns compared to the S&P 500. You can see it in the graph below.
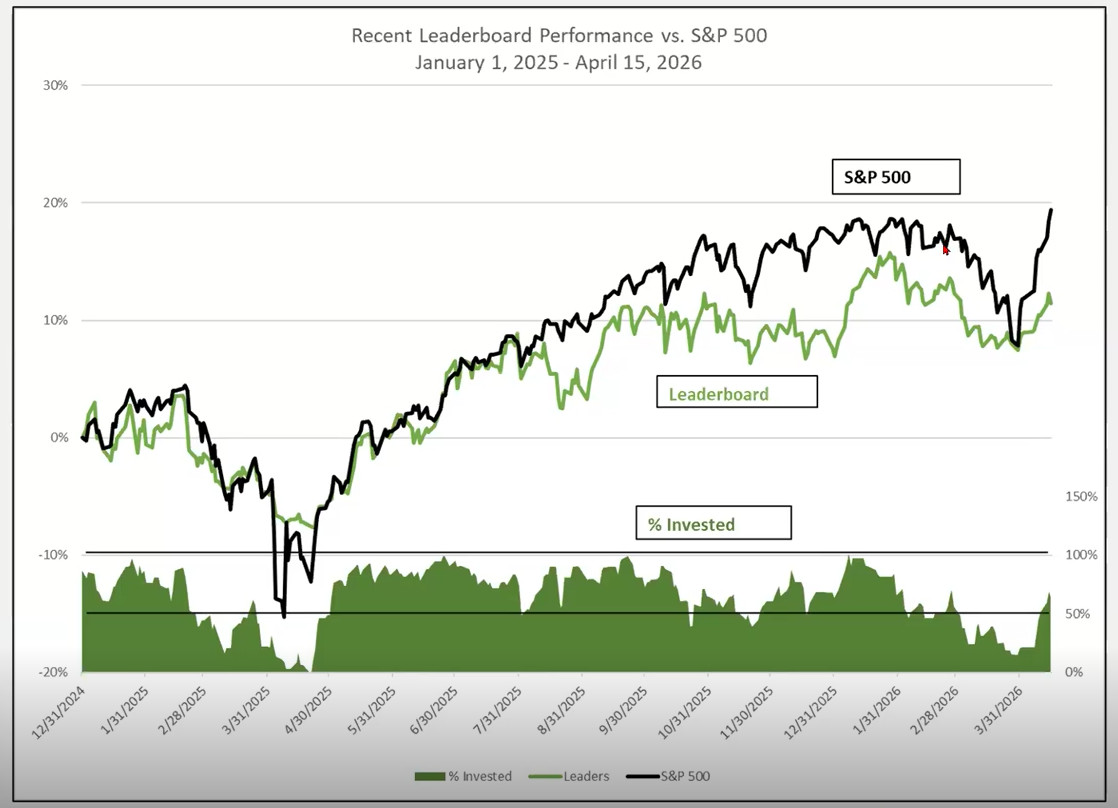
The period covered is for the last 15.5 months. Leaderboard’s model portfolio managed to achieve a 12% return. That gain is only 2/3 of what the S&P did with a 19% gain over the same time period. Here at Stocklocater, we also have a service that pinpoints when to buy and sell with index ETF’s. We call it the “Index Trading Strategy”. When it’s time to buy and sell we send you an alert. You login to your broker and make the trade. Over the same time period our model portfolio returned 71% (see chart below).

We all have only a certain amount of time before we retire (or pass away). The bigger the gains, the faster our money grows and the better chance we have of hitting our financial goals. Also remember, that past gains do not guarantee similar gains in the future. This is just a review of Leaderboard’s past performance. It has beaten the S&P in the past many times.
What Are My Costs?
Leaderboard costs $69 month. For Leaderboard’s 12% gain over 15.5 months you would have had to pay $1,069.5 ($69 x 15.5 months). To cover the cost of the subscription service, you would need to invest a minimum of $9,000 to break even. The profit on that $9,000 would cover the cost of the subscription. Compare that buying and holding SPY and paying $0 subscription fee, your $9,000 would have returned a profit of $1,710 during that time period.
Of course, neither of those two options compared to the returns of our own Index Trading Strategy. A subscription to ITS runs $29.95. Over the last 15.5 months you would have paid $433.22. That same $9,000 with ITS returns a profit of $6,390 minus the $433.22 subscription fee leaves a profit of $5,957 (rounded).
0% gain with Leaderboard, $1,710 with SPY, and $5,957 with ITS (after subscription fee). The reason one pays a subscription fee is to get a bigger return than if one bought and held SPY, and only ITS does that during this time period set by Leaderboard.
BIGGER gains at a much lower cost means more money in your pocket and a faster retirement. This Leaderboard review is just comparing the time period that Leaderboard itself used to showcase their returns. No guarantee future results are better or worse.
Can I Do This?
With Leaderboard, you get trade alerts for 10-15 stocks each month. Leaderboard will alert you with buy and sell points. It’s up to you to decide which ones you want to trade. If you do all of them, you could be in dozens of stocks at a time and spending lots of time at the computer trading and monitoring.
With the Index Trading Strategy have only one ETF to trade (ETF’s trade the same as stocks) and will do about 10-15 trades per year. Compare that to 120 to 180 with Leaderboard. Index Trading Strategy has less work for a much bigger return.
Is There A Money Back Guarantee?
Leaderboard has no money-back guarantee but they do give you a 4 week trial for $39.95. Not sure if that is enough time to see if it works, but should be enough time to verify returns and to see if it’s something you can follow.
The Index Trading Strategy offers a 30-Day Money-back Guarantee which means you pay up front (and the upfront cost is still lower than Leaderboard) but have 30 days to verify returns and see if it’s something you can do. Cancel within 30 days and get full refund of your subscription fee (and you don’t have to ask – comes automatically).
Conclusion
We have already seen that Leaderboard and the Index Trading Strategy both give you buy and sell alerts. The big difference seems to be that Index Trading Strategy costs much less, has you doing less work, and in the end you wind up with a bigger gain. I’ve put together a chart comparing Leaderboard against Index Trading Strategy. Hopefully it will help you make a decision, or subscribe to both for a few months and see which is better for you.
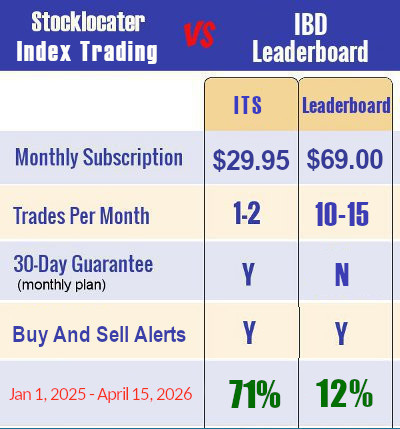
Now that you have the facts, I’m sure you can now make a more informed decision as to which service is a better fit for you. There is no guarantee that ITS, or Leaderboard will do similar gains in the future.
To your success.