

How To Do Market Timing
Once you learn how to do market timing, you can avoid the slow “buy and hold” approach and accelerate your returns. By tripling your returns over buy and hold, you can retire a lot sooner.
It is my goal in the post to have you tripling your market returns by understanding how to do market timing. I will reveal how I time the ups and downs in the market and how I profit from this knowledge using leveraged index ETF’s.
The Stock Market Is Cyclical
The market goes through cycles. Every 7-10 years there is a market crash. In every Bull or Bear market, stock prices go up and down. All of these cycles can be timed and used to your advantage to make big gains in the stock market.
Sure there is the occasional news story that erupts and disrupts the stock market. These too are part of the cycle. So let’s get started.
How To Do Market Timing
If you want to to know how to time the markets, you must first understand there are two market trends that need to be timed:
LONG TERM TREND
SHORT TERM TREND
Of the two, learning how to time the smaller ups and downs of the stock market (the short term trend) is a much more beneficial skill as you will use it every day. This is the market timing I will discuss in this article.
Establish Parameters
First you need to establish parameters to use for measuring the ups and downs in the markets. The markets work much like the waves of an ocean or the radio wave in the air.
Each up or down cycle in the market has a certain amount of time it took to complete that move. Also, that up/down move either made a small up/down move, or it made a big up/down move.
What you will want to do, is create a certain amount of different lengths to monitor and a certain amount of different heights to monitor. I personally monitor 6 different lengths of time and 3 different levels of volatility. My three volatilities are 0 for small amount, 1 for medium, and 2 for big volatility.
To visualize this, take a look at this chart:
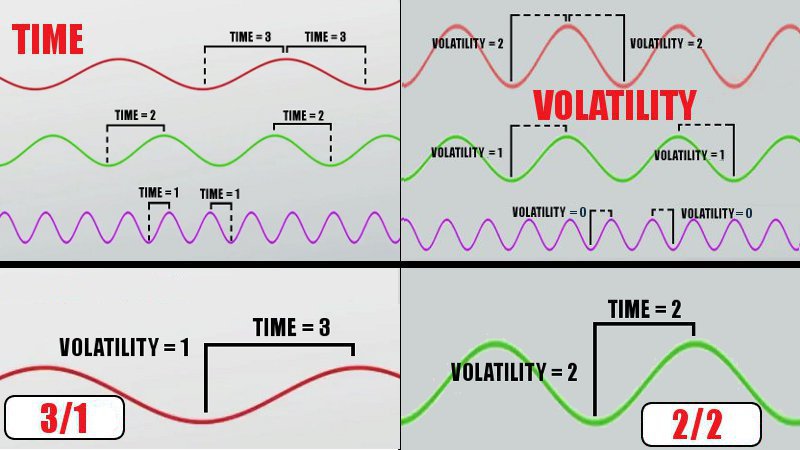
As you can see it displays different time lengths (which I call TIME) and different heights (called VOLATILITY). You monitor different levels of volatility over different time frames.
If you take your three levels of volatility and measure them over six different time lengths you will have 18 possible “waves” to monitor. What you are monitoring is how high/low the cycles are, and how long it’s taking to complete (how long it takes to go from trough to peak or peak to trough).
To determine which of the 18 possible “waves” is the correct one to use for timing the stock market today, I use the ETF’s TNA and TZA. When the wave is predicted to go down, I use TZA to see how much profit would be made during the time the market should be dropping. I do the same with TNA should the wave be going up. I then compare the returns of the 18 possible waves to one another. This will give me an idea of what the stock market is doing.
Real Life Example
In figure 1 you see the 18 different waves I monitor and their returns for the one year time frame from April 2016 to April 2017.
You can see the S&P 500 went up 11.93% in that time period. The waves that have a green check mark next to them are the waves in the stock market that would have returned more than 3x the S&P 500.
The important part is which waves are at the top of the list. This will give us a clue on how to time the stock market.
Note: I used TNA/TZA to achieve the returns. These ETF’s do 3x the Russell 2000 index. You can also use UPRO/SPXU which track the S&P 500 or any of the hundreds of other index ETF’s on the market today.

Take a look at the top 6 waves from that time frame. I label each wave with two numbers, the number on the left will be 1 through 6 and represents how long it takes for the wave to reach from trough to peak, or peak to trough. 1 is a shorter time frame and 6 is the longest.
You can see the majority are 5 and 6’s. The stock market is favoring longer time frames to make it’s move.
Waves with a 1,2, or 3 are the shorter time frames. 4,5,and 6 are the longer time frames. I prefer using a wave in the middle. Since the longer time frames work best, 5 is in the middle of 4-5-6 and also one of the hot time lengths that year, I would use 5 for the coming year.
The number on the right is the volatility. You will notice that in the top six, all 3 volatility levels are represented. If you go down the list, you will find all three are spread throughout. It is not lopsided in one direction as the numbers on the left were.
Once again I would use the middle setting. Volatility has either a 0 (small volatility), 1 (medium volatility), or 2 (big volatility). 1 is the middle setting for volatility.
PREDICTION FOR THE NEXT YEAR
Fast Forward One Year
My prediction came true. Trading the ups and downs of medium volatility over long time frames (5/1 wave) paid off. You can see the gains vs the S&P in figure 3.
Let’s repeat this for 2019.
Once again I’ve marked those waves that did 3x the S&P. Only two waves in this year were able to do it.
Once again I’ve put the red square on the top six waves (see figure 3). All of them have a 4, 5 or 6 on the left for time. What’s new on this chart compared to last year, there are now two 4’s in the top six waves. The markets are beginning to favor a slightly smaller time frame for the ups and downs.
As for volatility, once again all three level of volatility are represented. So I stick to the middle one, 1.
PREDICTION FOR THE NEXT YEAR
Fast Forward Another Year
My prediction came true again. Trading the ups and downs of medium volatility over long time frames (5/1 wave or 4/1 wave) paid off. You can see the gains vs the S&P in figure 4.
The S&P gained 9.38% this past year. By timing the markets and trading the ups and downs of the 4/1 or 5/1 wave, an investors would have done 15x or better than the S&P. This is the fast road to wealth, market timing.
Armed with this info, you are now ready to time and trade the ups and downs of the stock market.
Create your scale of time lengths. Then use Index ETF’s to test your various waves and see what works with your signals.
I do offer a service where you get access to my predictions and can trade the waves mentioned above. I’ll select the wave to trade and email or text you when to switch from one index ETF to the other. Couldn’t be easier. You can find more info on my Index Trading Strategy here.
