

Support and Resistance – How To Trade
Support and Resistance is an integral part of technical analysis. All chart patterns are based on support and resistance. So what is this support and resistance?
Stocks and market indices get trapped in a price range. They go up to a certain level and fall back down to a certain level. The price of a stock will trade within this range. The point where the stock reverses from a rally is called Resistance. The point where the stock reverses from a drop is called Support. This is usually the point where investors now find the price cheap enough they start buying, thus supporting the stock or index at a certain level.
One of the simplest chart patterns that uses support and resistance is Trend Lines. These are two lines that connect two or more points on a stock’s chart and extend into the future. Usually these lines will be parallel to one another.
Typically you would want to short a stock that hits it’s upper resistance line and buy the stock when it hits the lower support line. Typically a stock or index will bounce back and forth between the support and resistance line 3 or 4 times before it eventually “breaks out”. If a stock closes above the Support line or closes below the Resistance line, it has broken out of it’s trading range. If the stock/index does this on big volume, that’s an indication the stock/index will now rally or crash, creating more opportunities.
Take a look at Visa’s (stock symbol V) 3-month stock chart below. Here you can see that V was trading in a range of $69.07 and $74.64. $74.64 is the resistance, as V would fall every time it got in the price range. V would find support at $69.07. All a trader need do is buy around $69.10 and sell near $74.50 for a quick 8% gain. There were two instances of this in this three-month chart.
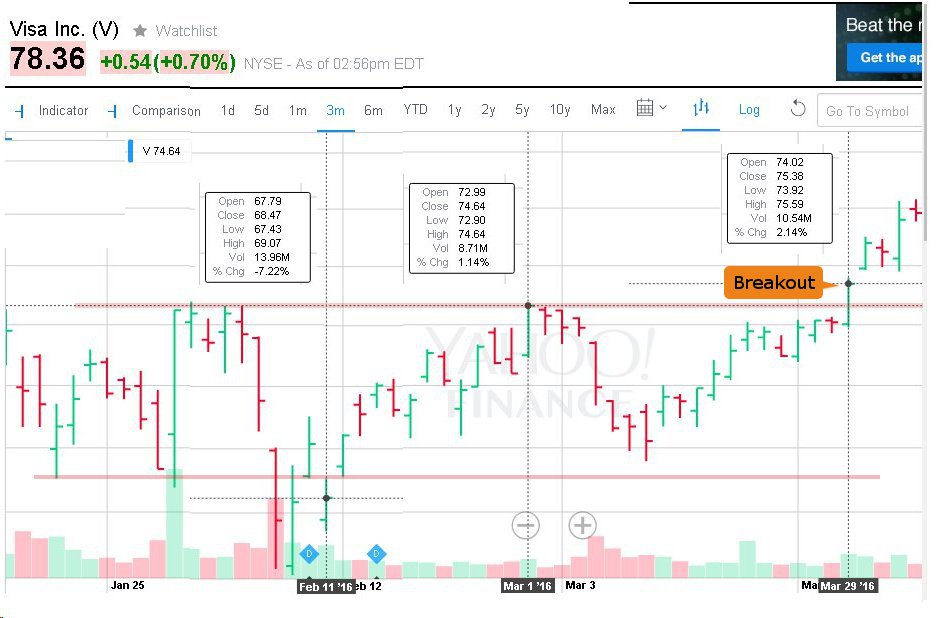
Eventually V broke out to the upside. The price to buy in the break out is 1 cent higher than it’s resistance level. In this case, resistance is at $74.64, so buying at $74.65 would be a good deal PROVIDED there was big volume. As you can see above, V had a volume of 10.54M on the break out day, bigger than it’s three-month average volume. This is a good sign that V is ready to rally.
Two Ways To Profit From Support And Resistance
1) Buy when the stock’s price hits the support level and sell when it hits resistance.
2) Buy when it breaks out to the upside AND only if on big volume.
One thing to note, once a stock breaks out to the upside, it’s former resistance level now becomes it’s support level. In the case of V above, the stock should find support (barring major market crash) at around $74.65. Should V drop there in the future, that would be a good time to buy.
