How It Works
NOTE: All the tables in the Member's Area update at 1:30 PM PST
ETF STATUS
This table displays the status of each ETF. An ETF will be either "in cash", "bought", or "inactive". If it has been bought, you can find the day bought, the buy price, and what the stop price is if any. In addition, you'll also find the current gain or loss.
When the website updates, any ETF's that were bought or sold that day will have a green box  next to the ETF's Symbol. This is very handy for matching up with what the system did that day to what you did. The green box makes it easy to spot what was traded that day.
What is INACTIVE?
This applies to only those ETF's that use a stop-loss. If an ETF triggers it's stop-loss it will be marked INACTIVE and will receive no further trade alerts. This is a fail safe in case the ETF is crashing. It will become ACTIVE again and be given buy and sell prices once it returns to it's normal trading pattern.
HOW TO BUY - BUY TARGETS
When you are ready to buy, login to the Member's Area. (1) Those with a green bar are below their buy price and a buy. Those with a red bar are outside their buy zone. The red bar keeps you informed how much your ETF needs to move before becoming a buy. This makes it easier to monitor how much your ETF needs to move before you need to buy.
Some ETF's need to rise up before they become a buy. Some need to go down before they become a buy. ETF TIMER will alert you
(1) if the ETF needs to rise or drop.
If your ETF needs to
RISE before becoming a buy, you can use a "Stop Market" order. When it reaches the buy price
(2), it will become a buy and your order executed at the market price. If your ETF needs to
DROP, you can use a "Limit Order" to buy at the buy price
(2) or better.

IMPORTANT
Buy prices change daily, so check daily for the next days buy prices. Updates 1:30PM PST. Feel free to make buys during after hour trading.
Buy prices given for the "Buy Targets" are just a close estimate. Official buy prices are actually based on the ETF's price at the CLOSE. Since we don't know what an ETF will close at that day, we can only give a estimate for you to use as a buy target. After the markets close and the website updates the table marked "Official Prices" will have the days official buy and sell prices.
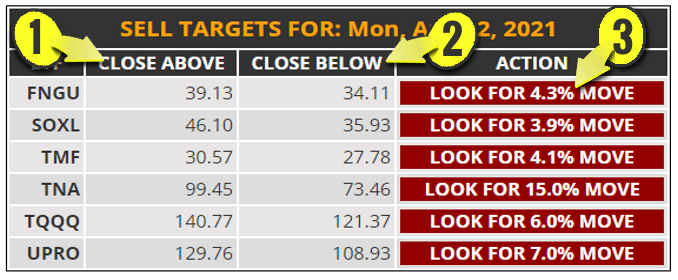
HOW TO SELL - SELL TARGETS
You get two sell prices, an upper
(1) and a lower sell price
(2). You sell based on the CLOSE. Your ETF has to close above the upper sell price or below the lower sell price. ETF TIMER also alerts you (the day before) how much it needs to move before hitting a sell price
(3).
If you see your ETF make that move, all you need do is check near the close to see if it will close above the upper or close below the lower. If so, close your position. If you can't login near the close, you can use a "Limit" order to sell on the upper price or a "Stop" order to sell on the lower price, but beware, doing so will get you a different result than the system results here.
Just like when buying, every day the sell prices change also. It is possible that the lower sell price could eventually go above your buy price before triggering.
IMPORTANT
Sell prices change daily, so check daily for the next days sell prices. Updates 1:30PM PST. Feel free to sell during after hour trading.
Some ETF's use a stop loss. You can view the stop percentages and which ETF's are affected in the "Stop-Loss" section below. If your ETF uses a stop price, set an order to sell at that price and forget it. Your stop price never changes, so set and forget it.
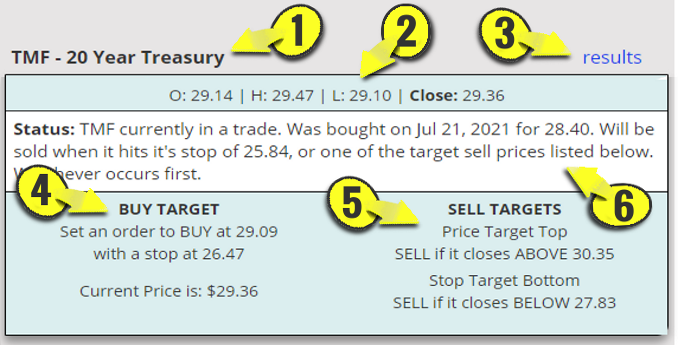
OFFICIAL PRICES
Should you ever lose where you are, ETF TIMER has you covered. Every day at 1:30PM PST the website updates and we post a table that shows what the buy and sell prices were for that day and if your ETF was bought or sold that day. To view this information, click on the name of your ETF
(1) from the list of ETF's.
The
STATUS section
(6) will inform you what the system has done. If you are trading this ETF, you should be doing the same.
If you are looking to buy, the BUY section
(4) shows the last trading day's buy price and stop price (if used). If you look at the low of the day
(2) you will see the ETF did not fall enough to trigger a buy. Missed it by a penny.
If you are looking to sell, you can see the ETF would have needed to close above $30.35
(5) or below 27.83 for this day. You can see the ETF closed at $29.36
(2). Not quite high or low enough to sell this day. Now you check to see what the next trading day's targets are and try again (see the SELL rules above).
OFFICIAL vs ESTIMATE
If you are wondering why the "Official" buy and sell prices are different than the buy and sell prices we quoted before the trading day began, this is the section for you.
We use a time range for calculating buy and sell prices. Since we don't know the next day's closing price we use today's closing price for calculating and estimating tomorrow's buy and sell prices. More than likely the ETF will not close at the same price as the day before and thus, our offical prices will vary slightly from the estimate.
Watch This Video For More Details
STOP-LOSS RULE
In addition to the upper and lower sell targets based on the CLOSING price, some of the ETF's here also come with a regular stop-loss. Since we normally sell based on the closing price, it is possible your ETF could fall so much it could close 20% or 30% lower. You don't want to sell that low. This stop-loss protects you from that.
If you buy about the same or higher than the sysem, use the systems stop price displayed in "Status". If you buy LOWER than the system, then set a stop price for your ETF using the percentage in the table below. Subtract that percentage from your buy price and that is your stop price.
After you buy your ETF, set your stop order to that price and forget it. This stop price never changes.
| ETF | % |
| FNGU | 6% |
| LABU | None |
| SOXL | None |
| SPXL | None |
| TECL | None |
| TMF | None |
| TNA | None |
| TQQQ | None |
| UPRO | None |
HOW TO CHOOSE AN ETF TO TRADE
To help you decide which ETF is best for you to trade, we offer two tools:
1)
RESEARCH TOOL has a bunch of stats to inform you which are the most profitable, which are the most volatile, how long you should expect a trade to last, etc. Each stat ranks the ETF's from best to worst.
2)
CLOSING DATA will display stats for each ETF also (see image below).
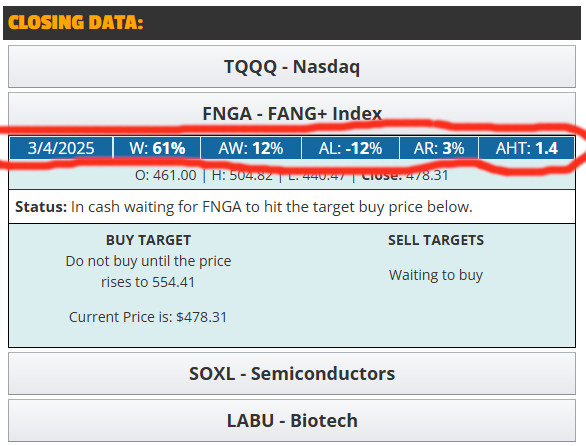
In the blue bar you will find that ETF's win percentage (
W), average winners gain (
AW), average losers loss (
AL), overall average return per trade (
AR), and average holding time (in weeks) to get the average return (
AHT). Use this data to compare one ETF to another. Example: above we see the average return is 3% for an average holding time of 1.4 weeks.
DIFFERENCES BETWEEN RESEARCH STATS AND CLOSING DATA STATS
Every few months we reevaluate each ETF's profits. If timing the ETF is not beating a "buy and hold" strategy we update the ETF's buy and sell points in hopes to make it more profitable. On the RESEARCH page, these stats refelect all trades the current buy/sell algorithm would have had for the past two years.
The stats on the CLOSING DATA reflect the "actual historical data" of the trades that were made for that ETF using ALL current and past algorithms used for determining buy and sell prices.
RECAP the former uses the numbers of the current algorithm had we traded that signal for the last two years, and the latter gives stats of actual trades made using all past algorithms.
With 8 ETF's to choose from, hopefully these two sets of stats will help guide you to an ETF that is right for your trading style.